The Health Care Operations Management textbook introduces four cornerstones to logistics and supply chain management
The Health Care Operations Management textbook introduces four cornerstones to logistics and supply chain management on page 247. Choose one area and conduct additional research beyond the scope of the textbook in the popular press and trade publications. Based on your research, evaluate and discuss the importance of communication and collaboration, information technology, and the budgeting process for effective facilities management.
Response Guidelines
Provide substantive comments to the posts of your peers according to the Faculty Expectations Response Guidelines, comparing their perspectives to yours. Ask any questions that will help you better understand their perspectives.
Once an operational strategy has been developed, it is usually necessary to evaluate the cost benefit of proposed and current service lines or activities. Hospitals represent significant opportunities for cost savings and operational efficiencies. This can be achieved by fixing processes, removing cost layers, and increasing the turnover or productivity ratios. One of the most common ways to improve operational efficiency is to use information and management systems and technology to automate processes and displace capital for labor. This takes careful analysis, however, to ensure that all technology benefits are captured and compared relative to the costs of acquisition and implementation. This chapter details how to analyze return on investment for technology and other projects.
LACK OF CAPITAL INVESTMENT MODELS IN HEALTH CARE
Health care organizations invest in capital programs for many reasons, but the most common is that it helps to automate, improve, or substitute capital for labor (Lucas, 1999). In many respects, the financial management of health care organizations has lagged behind other industries. Capital investment in facilities, equipment, and technology has not always utilized the traditional capital investment models; therefore, decisions are made based on other rationales besides financial viability. Following the standard of strict financial modeling techniques should be a top priority for operations managers. These financial modeling techniques will help clearly identify the expected changes in cost and revenue cash flows associated with the project through formalized discounted cash flows and net present value formulas. These models help quantify decisions and allow management to understand the bottom-line results of decisions in terms of the net economic value that is being contributed. More sophisticated health care organizations also follow return on investment models, but they are not significantly deployed throughout the industry.
Return on investment (ROI) is calculated as total amount of profits earned from a project or investment divided by the total cost of that investment. Typically, it looks at the effect of net cash flow from revenues and expenses over a specific time period, such as 3 or 5 years, using the concept of the time value of money. Formally, ROI can be defined as follows:

In health care, however, a large number of facility and technology investments are made for reasons unrelated to financial returns. New clinical technologies might help extend life, provide greater insight into disease that can improve diagnoses, or improve treatment success and morbidity rates. These are all potentially valid clinical outcomes and, after careful analyses, if the total nonfinancial benefit outweighs the costs, they should be considered in the capital budget. In addition, health care organizations tend to rely on the expertise of their leaders, who use heuristics and subjective gut feel to make decisions. Financial considerations have not always been the highest priority.
From an operations management perspective, however, capital budgeting processes must be driven by ROI and financial outcomes. The goal of operations management is to improve efficiency, competitiveness, and operations effectiveness, which require formalized ROI tools.
Unfortunately, because the greatest amount of a hospital’s investments are in clinical equipment, facilities, and information technology (IT), the typical hospital has not required ROI projections as part of its decision-making process. In addition, the finance and budgeting departments in the average hospital are usually understaffed and not overly sophisticated. Health care must become more proactive and advanced in its capital processes to accommodate ROI analysis for all capital investments.
THE POLITICS OF CAPITAL INVESTMENT
Hospitals tend to be highly social and political organizations. Physicians hold positions of power, and culture is independent of financial condition. Therefore, capital investment processes tend to have priorities focused on non-value-maximizing attributes. Physicians and other employees with political clout and power tend to dominate investment processes in health care and can influence decisions on technology in areas where they are the most interested or involved, regardless of financial value. In addition, because physicians often believe that administrators do not understand the value or consequence of their need or request, there is a general lack of trust in allowing business managers to make critical decisions about capital budgeting.
Prioritizations in the largest hospitals are based to a great degree on qualitative, not quantitative, data, which can be highly subjective. When decisions are qualitative, they do not allow for shared understanding of the criteria used to make such decisions (Weill & Ross, 2004). This causes a lack of alignment around the importance of different systems. These political investment processes do not generally follow formalized approaches and models that help ensure investment in the right areas. This encourages the wrong behavior and eventually leads to deteriorating financial health.
RECOMMENDATIONS FOR IMPLEMENTING A CAPITAL INVESTMENT APPROACH
It is important that hospitals use ROI approaches to capital budgeting. This requires clear, well-established investment guidelines. For example, a guideline might state that a specific percentage of the largest net present value projects will be funded during a fiscal year, or that any positive net present value project will be viewed favorably, or that any projects whose internal rate of return is more than double the cost of capital will be approved. All of these represent guidelines, which help explain the financial priorities to the organization and make the decision criteria clear. There are six key recommendations for incorporating ROI analysis into daily decision-making processes:
1. Define and measure the hospital’s true cost of capital.
2. Establish formalized ROI criteria.
3. Align investments with strategy.
4. Eliminate a single annual investment process.
5. Establish an IT portfolio approach.
6. Establish investment committees.
Each of these is described in the rest of this section.
Define and Measure the True Cost of Capital
Many organizations do not measure cost of capital, which makes investments very difficult. The cost of capital is the weighted average cost of all funding sources for a hospital, including both debt and equity (Patterson, 1995). The cost of capital sometimes is called the discount, or hurdle rate, which is the minimum rate of return required on projects. The cost of capital is a very important concept; unfortunately, it is not widely deployed in health care.
The cost of capital refers to the actual cost of money. For example, assume a hospital has no cash, stocks, or any other investments besides loans. This hospital can borrow from a bank, but it has no other sources of capital. The rate that the bank loans money to the hospital, then, is equal to its cost of capital. If the rate is equal to 6%, this means that if the hospital is to invest $500,000 in a project, it will really cost the organization $530,000 at the end of the first year ($500,000 × 6% interest charge); in other words, it will cost the organization $30,000 to borrow the funds. This cost has to be considered in the ROI equation because the total value or return from the project must now be incremented by this same amount.
Most hospitals, however, borrow money from banks over the short and long term, but they also are major issuers of debt in the form of public bonds. In addition, organizations lease or rent equipment, which has financing charges, and may even use revolving credit through organizational purchasing cards for limited working capital financing. The public for-profit hospital systems issue stock or equity through one of the stock exchanges, and more profitable hospitals tend to finance capital investments using cash or cash equivalents (through retained earnings). All of these represent sources of funds. Each source of funds has its own financing costs associated with it.
To calculate the true cost of capital for a hospital requires that the marginal costs of debt and equity be multiplied by the percentage of the market value that each represents. The comprehensive term for this is weighted average cost of capital(WACC). The formula for calculating WACC is:

where
| w= | weighting factor, or percentage of market value from either debt or capital |
| K= | cost of equity or debt |
| T= | marginal tax rate |
| d = | debt |
| e = | equity, either preferred or common |
In other words, WACC is based on the cost of debt in percent multiplied by the proportion of total capital that debt represents, plus the cost of equity in percent multiplied by the proportion of total capital that equity represents. Because most health care organizations do not issue stock, they have no associated costs of equity beyond that of the risk-free rate from cash equivalents or other reductions in retained earnings, which is primarily an opportunity cost. Therefore, in most organizations cost of capital is mainly a function of the cost of debt. Cost of debt can then be calculated as the cost of risk-free debt plus a risk premium.
Understanding the true blended cost of capital ensures that projects are not undertaken for purely the initial investment costs, but that they also reflect the financing effects, which can often add between 4% and 15% to a project’s total marginal cost. For large hospitals, an 8% to 10% cost of capital is fairly common.
Establish Formalized ROI Criteria
Part of the difficulty in health care is due to the fact that hospitals often do not have a dominant key performance metric for financial outcomes. In other industries, the use of return on invested capital, return on equity, earnings per share, or price-earnings ratios can be used to model financial decisions. In health care, there is still limited translation of the basic measures of profitability, such as operating margin and net income. Because these are limited in their usefulness due to accounting manipulations, they are often shortsighted in nature.
Clear guidelines for hospitals should be developed to factor in the cost of capital to drive investment decisions. Prioritization of investments around projects with the highest net present values or differential between return on capital and the hurdle rate is important if hospitals are to achieve operational excellence.
Align Investments with Strategy
Hospitals also need to align their investments in IT with the hospital’s strategies and initiatives (Keen & Digrius, 2003). Understanding the relationship between systems or technology and the hospital’s strategy will help clarify the effect on the organization. Technology that is clearly aligned with strategy should have the higher ranking, all other things being equal.
A hospital must have strategies across all areas of the organization for alignment to occur. The use of key performance indicators (KPIs) shows the effect that technology has on a specific KPI, and this can be cascaded back to the hospital’s overarching strategy and performance scorecard.
Eliminate a Single Annual Investment Process
In many organizations, capital investments can be made only once per year, at the beginning of a fiscal period. This creates a rush for funding at certain times of the year, such as January or September, which forces decisions among many projects simultaneously. This creates a competitive environment, where managers try to “game” the system rather than simply stating the benefits and facts around the investment. Annual processes discourage creative thinking year round and ultimately do nothing to improve financial results. Instead, revolving or year-round processes should be used so that as new ideas are developed—and as long as they make financial sense—they can be pursued.
Establish an IT Portfolio Approach
When investing in financial instruments, such as mutual funds or stocks, financial planners recommend taking a portfolio approach. A portfolio is a collection of investments grouped by different categories that are selected to help ensure a balanced and systematic approach to improving overall outcomes.
An IT portfolio balances the investments in various technologies so that they are not all concentrated around one area. For example, not all investments can be made in business systems that produce financial ROI, and not all investments can be made in clinical technologies with any direct, traceable returns. Similarly, not all capital decisions can be made around a system’s end of useful life. Categories for each of the key strategies in IT could be used to create a matrix to graphically represent the portfolio and ensure balanced investments.
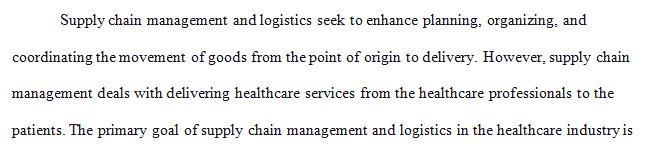
Another way to manage the portfolio is across the dimension of value versus risks and complexity. This suggests that even if the financial return or value is extremely high, complex projects tend to fail faster, and therefore the results may never be seen. The best case is a high-ROI and low-risk project, but those are rare. More than likely, a portfolio will include investments in all of the matrices of the portfolio. Figure 10–1 shows a sample portfolio grid.
Establish Investment Committees
The use of an investment steering committee, which is well represented by multiple functions of the hospital, helps to systematically evaluate potential technology or facility investment decisions. Alternatively, steering teams can be used to evaluate priorities for focused areas (e.g., one team for clinical activities, one for financial, one for nursing). Each committee should be encouraged to perform planning in its area to determine strategic measures or KPIs. For example, is process efficiency the number one goal, or is enhancing revenues? Many times, KPIs are not in place, so it may be necessary to first develop strategic criteria for activities that each committee can use for evaluation purposes.

FIGURE 10–1 IT Portfolio Management
These committees should use departments such as finance or management engineering to help evaluate the business case and ROI analyses being presented for funding. ROI analysis cannot be done well by the department or individual seeking funding, because there is an inherent conflict of interest and biases may exist. The use of other departments helps ensure consistent treatment of cost of capital, as well as cash flow considerations, and helps provide independence to the process.
No two individuals share the same tolerance for risk or the same risk profile. Therefore, when asked about the level of risk in an IT project, several individuals could rate the same level of risk very differently, simply based on their risk tolerance level. To minimize this bias, committees should use standardized measures of risk and complexity to keep that part of the portfolio as quantitative as possible. For example, ratings can be created based on the number of months for the project’s implementation (the greater the time, the greater the risk), total cost, the number of people or departments involved in the project, or some other quantitative guide that can help model risk fairly and consistently.
These committees should also use some form of expected value analysis, or weighted average ranking tool, for project acceptance. This tool allows the committee to evaluate the proposed IT project against key criteria and scale it based on the level of alignment around hospital-wide strategies and performance goals. Once decisions are made, they can be visually managed on a portfolio dashboard at both the committee and hospital levels.
VALIDATING RETURN ON INVESTMENT AT MULTIPLE STAGES
A sophisticated capital budgeting process should encourage the use of ROI analyses at multiple points in a project’s life cycle. This includes pre-implementation, mid-deployment, and post-implementation.
Prior to an investment in new technology, many hospitals use formal or informal executive reviews to analyze the benefits of the investment, even if a formal net present value or discounted cash flow tool is not deployed. In more sophisticated hospitals, steering committee evaluations are used to estimate alignment with hospital strategies and to use quantitative criteria to evaluate and rank IT investments across multiple categories. In the most sophisticated hospitals, the use of business case justifications with extensive ROI models are employed, which are complemented by a portfolio management approach.
While in the middle of deployment or implementation, hospitals should periodically review the project to ensure that no changes have been made—either to the conditions that necessitated the investment or to the underlying assumptions themselves (e.g., change in the cost of capital, change in implementation duration times). Mid-project reviews to assess the status and health of the project should be implemented, and the measurement of earned value recognized to date should be tracked. Earned value allows managers to compare costs incurred on a project against expected benefits of that project at the point of a certain percentage complete.

FIGURE 10–2 Multiple Points for ROI Analysis in Project Life Cycle
After the technology has been implemented and in production for a reasonable period of time, there should be formal follow-up reviews to evaluate if the technology is generating the ROIs that were projected during the initial business case. These post-implementation reviews compare expected results against actual results and try to find sources for the variances. For example, if expected results were to save $100,000 in operational expenses per year, but actual results show no savings, then an in-depth gap analysis should be conducted. This gap analysis should consider all of the historical assumptions for the change and identify which assumptions were ignored or invalid or if other changes mid-project resulted in the error for the initial projections. Figure 10–2 shows the types of analyses that can be conducted along the project’s life cycle.
CALCULATING RETURN ON INVESTMENT
There are three steps to measuring the ROI for a project:

Identify the Benefits
The first step in the ROI process is to identify and quantify the benefits. A benefit is a gain or positive change in an outcome and is often called the cash inflow or return. Benefits can be categorized into five areas, shown in descending order for their ability to quantify financial results:
• Those that create revenue enhancements.
• Those that cause reductions in operational expenses.
• Those that improve or expand service lines and levels.
• Those that improve the work environment.
• Those necessary for legal, regulatory, system end of life, or other reasons.
Revenue enhancements are the easiest area to quantify, but they represent a small percentage of total projects for most hospitals. Technology projects that enhance revenue would allow for expansions in revenue-generating areas, higher prices, larger market share, or other ways to exploit new opportunities for top-line revenue growth. For example, if a hospital were to develop an online patient referral and admission process, which could potentially attract new patients and new appointments, this could generate greater revenues. Likewise, investments in technologies that improve the hospital’s brand recognition could be seen as possible ways of increasing revenues.
Most projects, however, focus on reducing costs or expenses (also called cost savings or cost avoidance). Costs are defined here as all incurred costs of an investment, whether they were operationalized or capitalized, direct or indirect. Most IT project investments can be capitalized, or recognized as assets on the balance sheet, and the costs spread or depreciated over the time periods in which the benefits will be realized. These costs, however, should be treated the same in the ROI analysis, as shown later in this chapter. Direct expenses are those costs that directly relate to the service being provided and include labor, materials, and other such related costs. Indirect costs include space, utilities, insurance, and other costs that are necessary but not directly related to the process in question. Reducing costs due to higher productivity, improved reliability, faster cycle times, reduced manual efforts, elimination of duplicate or redundant data and systems, and overall higher efficiencies are benefits under this category.
Another benefit category includes projects that help expand or improve service lines. Improving accuracy, the quality of information provided, the level of care or service given, the access to information, and the ability to deliver more reliable or less variable performance are all areas represented in this benefit category.
Another benefit category is for projects that improve the work environment. These are difficult to measure financially, but they can have positive results. For example, ergonomic changes in a production process can allow for higher productivity due to less noise, reduced clutter, and less physical strain. Also, any projects that help generally improve the working conditions for employees can generate benefits in this category.
Finally, benefits derive by being in compliance with laws, regulations, and mandates, as well as from having current and fully supported systems. The cost of noncompliance with these areas could potentially generate penalties and legal problems that could otherwise be avoided. These areas are difficult to quantify, but they are nonetheless important considerations when making investment decisions.
Each of these benefits must be summarized. Then, calculation of estimated returns from these benefits should be prepared annually for at least 5 years, unless the technology is estimated to have a useful life less than that. Next, the cash flow impact needs to be detailed for each of the categories, defining all of the key assumptions. Finally, these benefits must be separated into annual time periods.
Consider this example. Assume a hospital is going to invest in a new technology that will bring in an additional 10 patients per month, as well as eliminate manual processes that would otherwise employ 2 full-time employees. Each employee makes approximately $30,000 annually, not including a 15% benefit package. Each new patient seen generates approximately $500 per quarter in net revenues. Calculate the total annual benefits. Ten patients generating $2,000 annually ($500 × 4 quarters) is $20,000 in revenue gains. Reduced operating expenses through cost savings are $69,000 (2 × $30,000 × 1.15), if both employees are realigned to other areas. Total benefits to be derived from this technology are $89,000 in the first year. Estimates for benefits in future years have to rely on assumptions for inflation, using the consumer price index as a gauge, as well as other changes that may occur over time. In addition, the time value of money (using cost of capital) has to be incorporated into more comprehensive analyses, as described later.
Calculate the Costs
It is important to capture all costs associated with the project. Costs represent cash outflows for an organization and include six primary areas: labor, hardware, software, implementation support (consulting, training), communications and infrastructure, and miscellaneous.
Labor expenses include the fully burdened personnel expenses associated with salaries, temporary labor, benefits, and training. Labor represents significant costs for most projects, and calculating these accurately at the detailed level allows for a much more comprehensive picture. The use of time and motion studies is encouraged to achieve a very detailed analysis of the actual time and effort associated with the process and/or project being considered. For example, if only 3 hours per day of total labor are connected to a specific process, it would not be accurate to show the costs for an entire employee. Instead, an average, hourly, fully burdened wage rate has to be constructed and multiplied against the actual hours used to estimate labor costs.
Hardware is another major expense area for most projects. Hardware includes all costs to purchase or lease workstations, desktops, printers, fax machines, servers, mainframes, storage devices, memory, and network devices, to name just a few. Often, new technology requires investment in new hardware, and a thorough analysis of all hardware requirements and costs must be considered.
Most technology has a software component. Software includes licensing fees, operating systems, and maintenance or support costs, which must be carefully considered. Implementation support includes the cost of consultants who will be used during the implementation period, as well as training and education costs, travel, internal resources devoted to the project, and any other costs of implementation. Communication and infrastructure fees include the cost of any telecommunications platforms or upgrades or additions to phone or data lines. Finally, a miscellaneous category can be used to capture any other project expenses that are not specifically listed in the categories given here.
Once all costs are identified, they need to be summarized by expense category and broken into the respective time period in which the expenses are actually incurred. These costs should be placed in the same spreadsheet as the benefits.
Model the Results
The final step in the ROI calculation is to model or quantify the results. This involves a direct comparison of the expected benefits less the expected costs. As stated earlier, ROI can be defined as the total amount of profits or gains earned from a project or investment divided by the total cost of that investment. Again, ROI is expressed mathematically as:

In simple terms, if a hospital generates $10 in benefits this year, but will expend $5 in costs to achieve those benefits, then the net gain will be $5. Expressed as a percentage, this represents

TIME VALUE OF MONEY
If investments were made today, and if the costs and benefits were only accrued today and not in the future, then the preceding method could be used to calculate ROI reasonably well. However, most large projects tend to have payoffs (i.e., payback on return) over several years. Some technology investments usually displace labor or manual effort forever, creating perpetual cost savings. Likewise, software maintenance fees (or support payments due to vendors to cover upgrades and enhancements) typically accompany many IT projects and are paid as long as the hospital wishes to remain current and continue to use the software. Capital budgeting is the process of planning asset expenditures over the long term, so a project can be evaluated by estimating the effects of multiple years of cash flows, both inflows and outflows.
As a result, the concept of time value of money is important. Time value of money is a financial concept: Money received in the present is worth more than the same amount received in the future. Money earns interest, so money received today can theoretically be placed in an investment (e.g., savings account, equities, or bonds) that can generate interest in the interim period, which would make the investment larger in the future. This concept is also referred to as compound interest theory, where interest compounds over time. Interest is the payment received by those who hold money to forgo current consumption. To calculate the true effect of interest, the use of present value is required. The present value of an amount is the value today of a future payment.
Consider this example. A hospital is due to receive revenue from a payer of $50. If it receives this revenue today, it is in fact worth $50. However, if it does not receive this money until next year, the hospital has lost the ability to invest it and compound the interest. Therefore, $50 next year is worth much less than $50 today. To calculate how much less, it is necessary to understand the present value formula, which can be expressed as:

where
| i = | interest rate, or discount rate, or cost of capital used by the hospital |
| n= | number of years in the future that the money will be received |
Going back to the earlier example, assuming a 10% discount rate (or hospital cost of capital), then $50 received next year will be worth $45. This can be calculated as

If the hospital received the money 1 year in the future from the payer, it would essentially be forfeiting, or giving up, $5 in total returns ($50 − $45).
Alternatively, because money received today can be invested, a dollar received today has greater value in the future. This is called the future value of an amount. It can be calculated as:

If $50 is received today, that same dollar will be worth $55 next year:

In other words, in the future, the hospital would be forfeiting not just $5, as found earlier, but actually $10, or 20% of its revenue, to receive the dollar in the future ($55 – $45). This shows the significant effect of the time value of money.
CALCULATING MULTIPLE CASH FLOWS
The preceding examples are fairly easy to calculate, as long as the discount rate or cost of capital to be used in the calculation is known. Although discount rate and cost of capital are often used interchangeably, the cost of capital is the actual weighted average cost of a hospital’s funding sources, which includes cost of debt (net of tax) and cost of equity. It represents the minimum required return to essentially break even on a project. The discount rate is simply the factor used in preparing present value analyses, and it may be the same as the cost of capital. Many organizations simply use the current interest rate or bond yields as proxies.
When using a stream of cash inflows and outflows, it is wise to use net present value concepts. Net present value (NPV) is the difference between the present value of any cash inflows (or benefits) and the present value of cash outflows (or costs), net of taxes. NPV is probably the most commonly used technique for ranking investment proposals and capital projects for most for-profit companies (Shefrin, 2006). Sophisticated hospitals use NPV, but it is not as widely understood and adopted across all hospitals. It is important to use NPV in capital rationing situations because, essentially, NPV measures the amount of economic value that is being added (or removed) from the hospital with each decision.
NPV discounts all after-tax cash flows back to the current year; it could be calculated by using the present value formula given earlier or by looking up the present value in tables that are commonly available. For example, if $50 were received in years 1, 2, and 3, the present value of those inflows would be $124.33:

Mathematically, NPV can be expressed as follows (Copeland, Koller, & Murrin, 1994):

where
| n = | number of future cash flow periods |
| t = | time period |
| k = | discount rate |
| PCFt= | periodic cash flow for period t |
As long as NPV > 0, the project should be accepted because economic value is being contributed to the organization. Exceptions to this include when capital rationing, or limiting of the capital budget, exists, in which case all projects should be ranked from highest to lowest NPV, and all projects should be accepted down to the cutoff point, where cumulative investment is equal to total capital budget.
Alternatively, a spreadsheet (such as Microsoft Excel) can be used with a builtin NPV function to provide even quicker analysis over different time periods. A sample ROI analysis spreadsheet is depicted in Figure 10–3.
OTHER RETURN ON INVESTMENT TECHNIQUES
Besides NPV, two of the more common methods for gauging the returns on projects are payback and internal rate of return. Paybackis the number of periods required to complete the return of the original investment and is defined as:

For example, if a technology upgrade cost $500,000 and each year there was a net positive cash inflow of $50,000, then the payback period would be 10 years ($500,000 ÷ $50,000). The advantage to using the payback method is its simplicity: It is intuitively easy to follow and calculate. The major disadvantage is that cash flows are not typically constant. One way around this is to cumulatively sum each year’s cash flows until the total investment is reached. Another major disadvantage is that it ignores the time value of money, as well as any cash flows that might be generated after the end of the payback period.

FIGURE 10–3 ROI Analysis Tool
The other common technique is internal rate of return. Internal rate of return is a computation in which the NPV of a project is equal to zero. Instead of the discount rate being held constant as in NPV, it becomes the dependent variable that must be solved for by setting NPV to zero and using the variable cash flows. Alternatively, a simple heuristic to determine internal rates of return is to divide 1 by the number of years of payback. For example, 1 divided by 10 years in the previous example suggests this project has a 10% internal rate of return. One major limitation to this technique is that while it provides an intuitive return percentage, it ignores the dollar value of the cash flows and therefore makes it difficult to compare investments of varying sizes.
Example
Bellingham Hospital is about to invest nearly $700,000 over the next 5 years to implement a tracking system that uses both bar code and radio frequency identification technologies; $500,000 will be paid in the first year, and the balance will be evenly split over the next 4 years. These technologies will initially be used to track two types of assets: durable medical equipment (especially infusion pumps) and transportation equipment (such as wheelchairs).
These technologies should help increase the utilization or turns associated with the equipment, which increases effective capacity. By making visible where assets are hiding, managers can better position and transport them so that they will not need to purchase as many pieces of equipment in the future. Currently, there is about a 50% utilization rate on both types of assets, suggesting that they are used only half of the time. There will be a projected cost savings of $350,000 annually in cost avoidance of future equipment expenditures for the next 3 years and then a savings of $250,000 for each of the following 2 years. However, there will be a need for one additional full-time employee to manage the systems, which will cost about $50,000 plus 15% benefits. The hospital IT department requires a 5% contingency expense in factoring all ROI analyses.
The hospital is nonprofit and therefore exempt from taxes. The existing financing is approximately 60% debt financing at a tax-free bond yield of 5%, and 40% equity at 7% (in this example, equity returns are based on a combination of existing cash and long-term marketable securities returns). Using a much-simplified version of the WACC, the cost of capital can be calculated as

Based on this, Bellingham Hospital typically uses a 6% discount or hurdle rate in all calculations. There is also no salvage or residual value left in this technology at the end of the 5-year period, which represents the useful or economic life of these systems.
Is this a good investment for the hospital? Simply looking at the sum of all benefits over 5 years suggests that $1.55 million in benefits will result from a total capital investment of $700,000, with only $287,500 in operating expenses. Using discounted cash flows, with all of the assumptions defined, the first year net cash outflow is $235,375, which comprises cash outflows of $500,000 for the technology, $57,500 for the fully burdened staff, and $27,875 for the project contingency, for a total outflow of $585,375. Cash inflows, or benefits, amount to $350,000 in that first year. In years 2 and 3, there are positive net cash inflows of $237,125 annually. In years 4 and 5, each period had annual inflows of $137,125. At a 6% discount rate, the NPV of this project would amount to $399,000. Any NPV that is greater than zero should be accepted, assuming no capital rationing is in effect, and so this project is indeed a worthwhile financial investment.
CHAPTER SUMMARY
Investments in capital for new facilities, equipment, and technology are often good uses of cash flows if they provide a return at least equal to the costs. Benefits of these investments often include an increase in productivity, displacement of labor, cost avoidance, increased revenue, or other benefits. The costs of capital, however, can be enormous, which can change the economics of the project. It is important to thoroughly understand all aspects of expenses—hardware, software, infrastructure, implementation support, labor, and all other costs to fully model the cash flow results. Careful analysis of the benefits relative to the gains and use of a discounted cash flow approach to measuring inflows and outflows are necessary to gauge the effectiveness of each project. NPV, payback, and internal rate of return are three of the more sophisticated techniques for evaluating capital investments pre-implementation.
KEY TERMS
Benefit
Capitalized
Cash inflow
Cash outflows
Cost of capital
Future value
Hurdle rate
Interest
Internal rate of return
Net present value (NPV)
Payback
Answer preview The Health Care Operations Management textbook introduces four cornerstones to logistics and supply chain management
APA
781 words